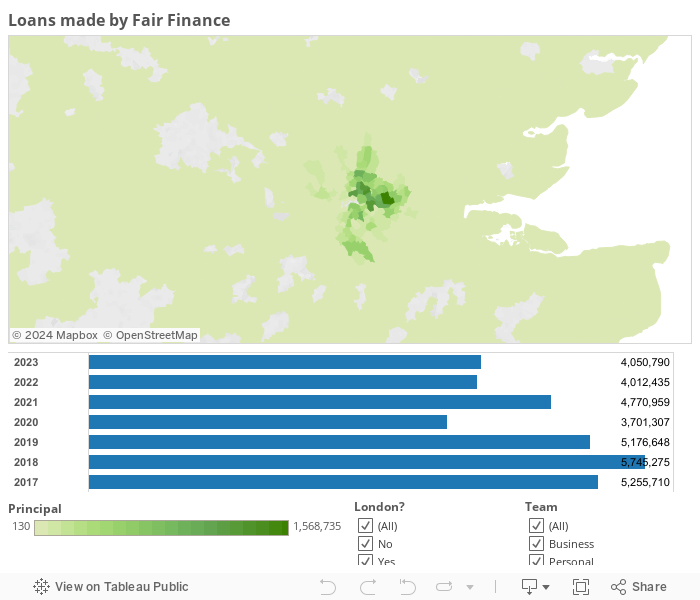
The maps below details all the loans Fair Finance has made since we launched in 2005 by Personal and Business loans and by volume and value. This helps to show the impact that Fair Finance has on financially excluded communities around the UK
The map shows postcode districts (e.g. E8) for all of the UK (feel free to re-size)
As well as using the toggles, you can select any area on the map, or any year in the chart to see how our lending has evolved over time, or across the country.
Please note that this page isn’t optimised for mobiles, we recommend viewing on a laptop or PC.
Data up until 30th November 2023
Data last updated to 8th December 2023