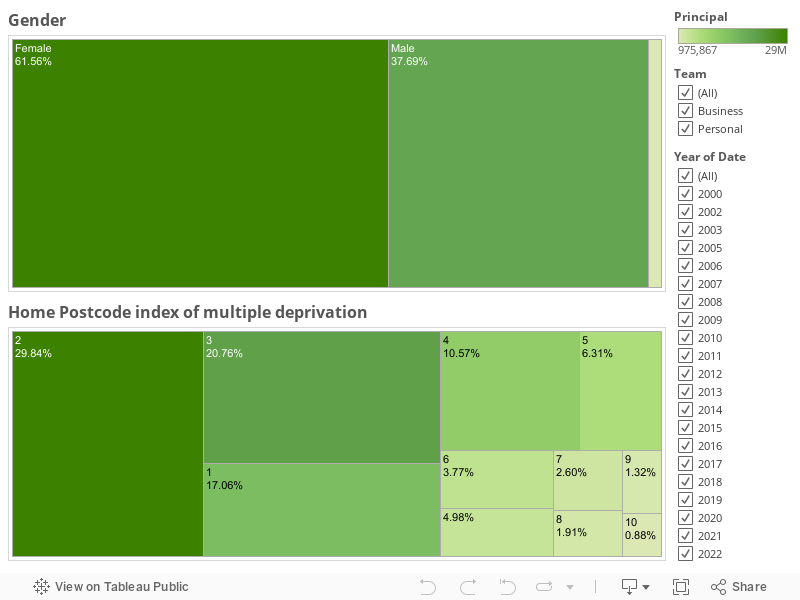
The charts below show the key demographic information for all the loans Fair Finance has made since we launched in 2005. This helps explain Fair Finance’s impact on financially excluded communities around the UK. You can see that we lend disproportionately in the most deprived areas of the UK.
As well as using the toggles, you can select any of the blocks in the charts (e.g. Female, Index of Multiple Deprivation score of 1) and the rest of the charts will update as well.
Please note that this page isn’t optimised for mobiles, we recommend viewing on a laptop or PC.
Data up until 30th November 2023.
Last updated 8th December 2023.